Saturday, June 13, 2020

Coronavirus Lockdown XXI: Why small is not beautiful in the time of pandemic

The global fight against health and economic crises highlights the need for big government spending and better redistribution to protect people, not less

twitter-logo Prasanna Mohanty        Last Updated: June 6, 2020  | 17:44 IST
Coronavirus Lockdown XXI: Why small is not beautiful in the time of pandemic
In 2018, India's general government expenditure (Centre and states combined) was just 18.2% of its GDP
On June 5, when the US recorded more than 1.1 lakh deaths from COVID-19, maintaining lead and accounting for 28% of all such deaths in the world, Nobel laureate Paul Krugman revealed something about the US's health system few outsiders know.
In an article in the New York Times, he wrote, "Non-American friends sometimes ask me why the world's richest major nation doesn't have universal health care. The answer is race: We almost got universal coverage in 1947, but segregationists blocked it out of fear that it would lead to integrated hospitals (which Medicare did do in the 1960s.) Most of the states that have refused to expand Medicaid coverage under the Affordable Care Act, even though the federal government would bear the great bulk of the cost, are former slave states."
And then, he adds, "The Italian-American economist Alberto Alesina suddenly died on March 23; among his best work was a joint paper that examined the reasons America doesn't have a European-style welfare state. The answer, documented at length, was racial division: in America, too many of us think of the beneficiaries of support as Those People, not like us."
That discrimination can cause havoc even in one of the wealthiest countries needs no further elaboration. It is there for all, including India, to see and learn from.
The European model versus the US one
The work Krugman refers to was published in 2001 by Harvard University, 'Why Doesn't the US Have a European-Style Welfare State'. The concluding paragraph of it puts the findings very succinctly and is reproduced below.
It had found many more outcomes which are relevant. It said "post-tax income inequality is lower in countries with large governments and in particular, with large social spending", adding that "it is pretty clear that income inequality is lower in Nordic countries, intermediate in central and southern Europe, higher in the UK and even higher in the US".
The situation remains unchanged since then.
A 2019 OECD study shows that the average social spending of its members (37 countries, including the US and European countries) was above 20% of GDP in 2018. Many European countries like France (more than 30%), Belgium, Finland, Denmark, Italy, Sweden, Germany, Norway and even the UK (just above 20%) spent more than the average, while the US spent less.
India's social sector spending is awfully low in comparison. India has been spending (Centre and states combined) less than 8%. The health sector spending has remained at 2.8-3.2% since FY12.
The size of government is measured as general government expenditure relative to the size of economy of a country (GDP).
The OECD database shows the average size of government in 2018 in 28 member countries (for which data is available), was 43%. Many European governments were spending more than 50% of their respective GDPs (like France, Finland, Belgium, and Denmark). The US was, again, in the bottom pile with 38%.
The US is considered a 'small government'. India is even smaller in comparison.
In 2018, India's general government expenditure (Centre and states combined) was just 18.2% of its GDP. Since FY12, the number has been confined to a narrow band of 17.2-18.4%.
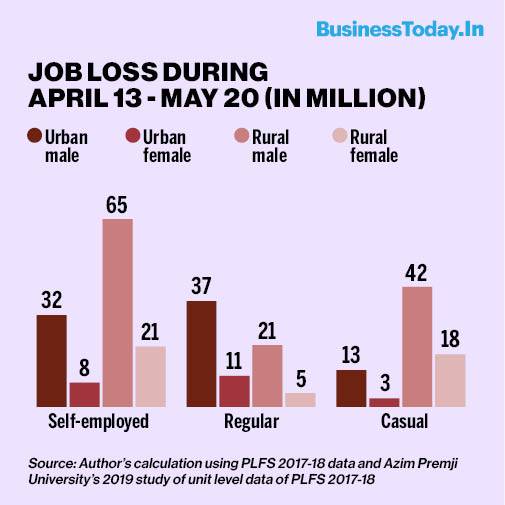
The impact of low social sector spending and small government is evident in India now. The plight of the migrants, fleeing in millions back to their villages for weeks, some of them walking hundreds of miles with kids and elderly, is one.
The second is gross inadequacies of its healthcare system exposed by the virus and the third is its inability to provide a big fiscal stimulus (fiscal spending announced in its relief packages amount to just 1% of its GDP) which is needed to kick-start the locked down economy.
One caveat is in order. Economists attribute the low government spending in India (small government) to its relatively lower tax revenue. India's tax-to-GDP ratio is less than 20% (Centre and states combined).
In FY19, it was 18.5%. For the OECD countries (which comes closest to India's FY19), the average was 34.3% in 2018 (of 34 countries for which data is available). Here too, the US lagged behind with 24.3%.
Small government is not beautiful
A few days earlier, when the US was about to record 100,000 deaths, another Nobel laureate, Joseph Stiglitz had spoken about the US's broken healthcare and other shortcomings in handling the crisis.
In an interview (on May 26), he said, "I think Americans have become aware as a result of the pandemic that there are some aspects of our economy and our society that aren't functioning well, that we don't have a functioning healthcare system, that the pandemic has gone after people in poor health and we have so many more of those people in the US than you'd expect in a rich country."
He pinned the ills on 40 years of economic thinking that denigrated the role of government (advocating small government) while allowing unrestrained market forces to prevail. This is not restricted to the US alone but has spread to other countries too.
He suggested a course correction, reminding that while it is the duty of governments to handle the crisis; the market isn't geared for it.
It is fairly known that a strong push for small government came in 1980s when multilateral US-based agencies like the International Monetary Fund (IMF) played a key role (read Coronavirus Lockdown XVII: The economics behind India's Rs 21 lakh crore package).
In this economics, there is little room for the European-style welfare state which spends more on social security (redistributes more) and has big governments. But the IMF has begun to see merit in it.
Even before the COVID-19 pandemic hit the world, it published a paper in December 2018, 'Shifting Tides: Dramatic social changes mean the welfare state is more necessary than ever'. It found the welfare state as a means to absorb the risks that market failure can produce.
In all, it cited three reasons for this shift in thinking, as reproduced below.
Talking about healthcare risks, it says the US is "unique among advanced economies" to rely on private actuarial insurance to address its health risks while "it is almost universally accepted among advanced economies that intractable market failures make private actuarial insurance a bad fit for medical risks..."
Health economist Dr. Indranil Mukhopadhyay of OP Jindal University explains what private actuarial insurance is and why it is prone to market failures.
About the insurance model, he says, "The private voluntary insurance that we buy for us and our families works on calculation of risks, a method called actuarial science. To put it simply, it estimates the financial risks of say, hospitalisation, for the population. The actuarial premium to be paid is the average cost of care adjusted for diverse risks of falling ill. In practice, however, management and administrative costs and profits are added ('overload'), increasing the premium."
About the associated market failures, he states, "There are well-known market failures of such voluntary health insurance. First, in order to make profit, such schemes work on exclusion and claim rejection. They tend to include healthy and young people and exclude the needy ('cream-skimming'). They reject a lot of claims and expect patients to bear a part of the cost; people are thus denied care or end up paying huge bills.
"This is very common in the US and in India. The main purpose of risk pooling, financial protection, and free care thus gets defeated. Moreover, it creates monopolies in the hospital market; big hospital chains eat up the small ones, and cost of care increases further."
A US-based doctor explains the consequences for the US in simpler words: Health costs are very high even for the young and many, like the unemployed and poor don't have health insurance cover and are deprived of healthcare.
Newspapers have been highlighting the plight of US citizens fighting the pandemic. One particular article in The Guardian sums it all up well in the headline, "Profit over people, cost over care: America's broken healthcare exposed by virus".
India needs to be on guard against following the same path.

Coronavirus Lockdown XX: 276 million unemployed, economy in doldrums; time to recaliberate India's response

Latest job loss survey and national accounts statistics point to the need for strengthening PDS supply and cash transfers to reach more people, assisting self-employed/micro-enterprises, additional allocation for MGNREGS and a job scheme for urban areas

twitter-logo Prasanna Mohanty        Last Updated: June 3, 2020  | 16:33 IST
Coronavirus Lockdown XX: 276 million unemployed, economy in doldrums; time to recaliberate India's response
Of the 276.2 million people who have lost their jobs, 103.7 million reside in urban areas while 128.5 million dwell in rural areas
By now it is clear that no government agency is tracking the massive job loss that the COVID-19 pandemic-induced lockdown has caused. On June 1, a union minister admitted it in so many words. This is the first hurdle to designing the right response. However, many non-government agencies, including the Mumbai-based Centre for Monitoring Indian Economy (CMIE) and the Bangalore-based Azim Premji University, are tracking job loss (as well as the impact of relief measures) which can be used for redesigning the responses.
Magnitude of livelihood crisis: Job loss and reverse migration
The Azim Premji University's survey provides a detailed account of job loss across all three categories of workers - self-employed, regular and casual - in urban and rural areas as well as for male and female workers.
Its findings, based on the survey carried out during April 13-May 20, 2020 across 12 states, show a high percentage of job loss across the spectrum - as reproduced below.
The percentage of job loss translates into a total loss of 276.2 million jobs.
This estimate is arrived at by taking into consideration two factors: (i) total workforce at 465.1 million for 2017-18, as estimated by Azim Premji University's 2019 study that analysed the unit level data provided by the Periodic Labour Force Survey (PLFS) of 2017-18 and (ii) using the same proportion of male and female workers, in urban and rural areas and across all three categories of workers as the PLFS of 2017-18 findings suggest.
The actual numbers could be different, but no official data is available beyond 2017-18.
Of the 276.2 million people who have lost their jobs, 103.7 million reside in urban areas while 128.5 million dwell in rural areas (mapped below).
The number of actual affected people would be more because a large number of migrants going home are taking their families along. Most of them are going to Uttar Pradesh, Bihar, Jharkhand, West Bengal, and Madhya Pradesh, some of the most backward states with limited financial resources.
Additional stress for the slowing economy
Every reverse migration puts additional burden on the rural economy. Firstly, there would be no remittances from urban areas to support the rural economy. Some estimates suggest 80% plunge in domestic remittances by the first week of April. Secondly, there is a massive job loss in the rural areas also, reducing the pie further.
Urban areas are now without a significant chunk of workers. Even if they return and economic activities begin immediately, the fear of the virus, social distancing norms in factories, offices, and housing would prevent their re-hiring en masse. Re-hiring would be staggered.
But more importantly, there may not be enough room or economic activities for re-hiring them for many months. Here is why.
Going back to pre-pandemic GDP growth rate may take long
The latest national accounts statistics released on May 29, 2020, shows that the GDP growth in the last quarter of FY20 (January to March) slumped to 3.1% - the lowest in 44 quarters (11 years since 3.09% in FY09).
The real state of the economy in the first quarter of FY21 would be far worse (would be known in August).
The quarterly data released for FY19 and FY20 shows agriculture recording far better growth, touching 5.9% in Q4 of FY20, which is higher than the rest but here is a catch. Its share in total GVA for Q4 of FY20 is 15.6%, while it supports 43.21% of the total workforce of India, as per the ILO data for 2019 (that would closely match with FY20).
Evidently, the income generated from agriculture is too low to adequately support the additional influx even with higher growth.
The growth in manufacturing has been negative for three quarters and in construction for two. The numbers could be far worse in the current fiscal, seriously limiting their capacity to absorb workers. In Q4 of FY20, the manufacturing's share of GVA is 17.8% while its share of workers is 11.4%; the share of construction in GVA is 7.9% while its share of workers is 12.3% (using ILO estimates for 2019 for workers' share).
The current fiscal (FY21) is likely to witness negative GDP growth, as the RBI governor said on May 22. Economist Pronab Sen warns that if the stimulus is not sufficient (fiscal spending of 10% of the GDP), the negative growth may spread to the next fiscal (FY22), dragging India into a depression.
All this would mean the level of economic activity may not be good enough for a year or more to accommodate all those who have lost jobs and livelihoods (the self-employed, for example). The overall growth rate has to reach at least the pre-COVID-19 level for that.
That is why India needs to recalibrate its strategies towards workers and their families.
Recalibrating response to human suffering
The Azim Premji University's survey also maps how the lockdown and subsequent job and livelihood losses have impacted households.
It says 83% of urban and 73% of rural households are consuming less food than before, which is expected in such circumstances. It also says that 64% urban and 35% of rural households don't have enough money to buy a week's worth of essentials. This should be a cause of worry.
As for the relief measures, 84.8% of the rural and 65% of urban households received ration; 41% of vulnerable households in rural areas and 23.8% in urban areas received Jan Dhan Account transfers; 26% of rural households received the PM-KISAN transfers and 58% and 36% of households in rural and urban areas, respectively, received at least one cash transfer.
The task is, therefore, to reach out to the left out vulnerable households with more food supply through the public distribution system (PDS) and more cash transfers.
Idle construction workers' fund, inadequate MGNREGS allocation
Though the March relief package allowed Rs 52,000 crore lying idle in the construction workers' welfare fund to be transferred to them, there is no indication of any progress.  
This is primarily because the fund has been largely sitting idle for decades.
This fund resulted from two central laws of 1966 - The Building and Other Construction Workers (Regulation of Employment and Conditions of Service) Act of 1996 and The Building and Other Construction Workers' Welfare Cess Act of 1996.
In 2018, the Supreme Court took note of official apathy in not passing on the benefits and entitlements to construction workers, pointing out that millions of construction workers had not been identified and their whereabouts not known. It also pointed to a Comptroller and Auditor General (CAG) report which had red-flagged the same.
Since then, two new labour codes have been introduced in the Parliament - Occupational Safety, Health and Working Condition Code (OSFWC) of 2019 and Code on Social Security (CSS) of 2019 - proposing to repeal these laws. Thus, the utilisation of the fund is suspect.
Another key tool for relief is the rural job guarantee scheme, MGNREGS. An additional allocation of Rs 40,000 crore has been made in the Rs 21 lakh crore relief package, taking the total allocation for FY21 to Rs 100,568 crore. However, Rs 11,000 crore of this is pending dues for FY20, reducing the availability to Rs 89,568 crore.
Prof. Reetika Khera of the IIM-Ahmedabad, who has been studying the MGNREGS works, estimates that Rs 2.8 lakh crore would be needed to provide 100 days of work to the existing 140 million job card holding households- much more than the current allocation.
Accommodating additional demand for work from the migrants and those who lost their jobs in rural areas would require additional allocation.
Job scheme in urban areas and assistance for self-employed
For years economists have been seeking a MGNREGS-like job guarantee scheme for urban areas because of high unemployment. The current situation highlights the need for this even more.
This will not only benefit those who have lost jobs and stayed back, but also those who return to seek jobs but would have to wait for many months before the economic activities pick up to re-hire them.
The self-employed workers constitute 52.2% of India's total workforce and have been badly hit due to the lockdown too. They are the ones who run micro-enterprises, that constitute 99.46% of units and provide 97% of employment in the MSME sector - according to the ministry of MSME's 2018-19 annual report.
These micro enterprises are more or less evenly spread in rural and urban areas and on an average, employ less than 2 workers, meaning that many are a one-man show.
All credit facilities for the MSME sector announced so far (Rs 3 lakh crore emergency working capital or Rs 20,000 crore subordinate debt) are more likely to bypass the micro-units. Even the Fund of Funds, set up for equity infusion of Rs 50,000 crore (but only with a corpus of Rs 10,000 crore), is meant for expansion in size and capacity of MSMEs and encouraging their listing in stock markets.
This too is unlikely to offer much help to micro-enterprises under a threat to survive.
It is for all these reasons that India's response needs to be redesigned so that a large part of its population rides over the multiple crises facing them.

Coronavirus Lockdown XIX: Where is excess liquidity generated by RBI going?

RBI data shows excess liquidity is lying idle, parked in its own reverse repo account, and burdening it with higher interest payouts. This could be tapped and channelised for additional fiscal spending to stimulate growth through government bonds

twitter-logo Prasanna Mohanty        Last Updated: June 3, 2020  | 15:11 IST
Coronavirus Lockdown XIX: Where is excess liquidity generated by RBI going?
The RBI has cut repo rate from 5.15% to 4% and the reverse repo rate from 4.9% on 3.35% during January to May 2020
The last time the Reserve Bank of India (RBI) spelt out its monetary policy on May 22, it reduced the repo rate (at which commercial banks borrow money from it) and the reverse repo rate (it pays to commercial banks), reiterating its "pro-active" liquidity management policy to "augment system-level liquidity" even while admitting that "credit growth remains muted" and that "high-frequency indicators point to a collapse in demand beginning March 2020 across both urban and rural segments".
The RBI has been on a liquidity infusion spree for quite some time. It has brought the cash reserve ratio (CRR), freeing up more money in commercial banks for lending, repeatedly cutting the repo rate and using instruments like Long-Term Repo Operations, Targeted Long Term Repo Operations, Targeted Long Term Repo Operations 2.0, etc. to generate more liquidity.
But what is happening to the excess liquidity being generated?
Where is this liquidity infusion going?
Here is what the RBI's high-frequency data shows.
The following graph uses the RBI's money market operation data (from January 1 to May 28, 2020) to map deposits in its reverse repo account - where commercial banks park their money for a day or more when they don't or can't lend.
It shows a dramatic rise in deposits from a few thousand crore of rupee in January and February to more than Rs 8 lakh crore in May.
The repo rate has been cut from 5.15% to 4% and the reverse repo rate from 4.9% on 3.35% during this period (January to May 2020). In March it had cut the CRR to 3% for a period of one year, from 4%.
Cuts in the reverse repo rate is to discourage banks from parking their money with the RBI and lend it, instead, to productive or real sectors where they would earn higher interest, but it has made little difference.
Net liquidity injection is negative
The following graph uses the RBI's daily bulletin on money market operations for the month of May 2020. These statements have a specific row marked "Net liquidity injected from today's operations".
As the graph shows, the net liquidity injection into the economy is negative, and hugely so. This corresponds to the reverse repo deposits (fixed). The net liquidity injection crossed the (-) Rs 8 lakh crore mark several times in the month.
Poor demand for credit in the economy
There is another indicator of the movement of liquidity: growth in credit outflow.
The next graph maps growth in credit outflow to the non-food sectors (all sectors except for food grain procurement), like agriculture, small, medium and large industries, services and personal loans for housing, education, consumer durables, vehicles etc.
The annual growth rate of credit to the non-food sector shows a significant fall to 6.7% in FY20 - which is a 58-year low. The decline has been steady for several years.
The monthly credit growth for FY20 has remained less than 4%.
A few things are clear from the above four graphs.
One, with greater liquidity, more and more money is sitting idle in the RBI's reverse repo account where it is not needed.
Two, the reverse repo rate may have been lowered, but the quantum jump in deposits is creating a higher interest liability for the RBI.
Three, higher liquidity is not going where it is needed, that is the productive or real sectors of the economy which produce goods and services, because banks are averse to lending due to stressed assets and lack of demand.
Is India in a liquidity trap?
The RBI's data demonstrates how its best efforts to generate more liquidity in the system have not translated into higher credit outflow or investment in the past few years.
That is because there is more to investment than just interest rates. While the industry already has excess capacity (both production and capacity utilisation had been reduced even before the pandemic hit), the lowering of interest or higher infusion of liquidity is of no use until demand revives and the economy starts growing again.
The Credit Suisse's May 26 report, 'India Financial Sector', says despite growing liquidity, banks have turned even more risk-averse and in the past 12 months, more than 90% of their incremental lending has been to >A-rated corporates. (Many of the banks are in the process of mergers announced earlier.) The report further says, NBFCs have held back after the collapse of the IL&FS in 2018; small private banks are pulling back and ECBs and bond markets are shut, leading to a major constraint on the financial system's lending.
On May 22, the RBI governor declared that the GDP growth in FY21 is likely to be negative. This would mean the economy would not be restored to its pre-pandemic growth level in FY21 and hence, the chances of growth in credit or investment picking up are very low for a year or more.
Prof Arun Kumar of Delhi's Institute of Social Sciences says, "We are in a liquidity trap, which means cutting interest rate will not lead to increase in investment".
India needs to rethink how to stimulate growth beyond just liquidity infusions.
What options India has to stimulate growth?
It is important to repeat that the lockdown has caused a massive loss of jobs and other livelihood options for people causing a demand depression. Leading economists have been arguing for quite some time that India needs to do primarily two things: (i) provide cash support to those who have lost jobs and other livelihood options and (ii) spend more keeping fiscal deficit concerns aside for the moment. Both would help in generating demand.
In May the central government increased gross market borrowing by Rs 4.2 lakh crore for FY21, taking the total to Rs 12 lakh crore, but this is aimed at filling the fall in revenue, rather than extra fiscal spending, and would raise the fiscal deficit from 3.5% to 5.5%. The fiscal spending component in the Rs 21 lakh crore package is only about 1% of the GDP. Additionally, the states have been allowed to borrow more - from 3% of GSDP to 5%.
Will this be enough?
Business Today spoke with two economists with decades of experience in running India's economic affairs - Dr. C Rangarajan and Pronab Sen. Both think the current level of additional fiscal spending is not enough given the dire strait of the economy. They think spending 5% of the GDP (Rs 10 lakh crore) would be more appropriate with one difference. Rangarajan favours a staggered approach while Sen is for immediate action.
Rangarajan points to fiscal constraints in mobilising additional resources. He says the fiscal deficit is already touching 12% or more (centre and states taken together) while household savings (financial savings available for investment) are low (dipped to 6.5% of the GDP in FY19) and therefore, the RBI would have to monetise the current level of deficit. His suggestion: the government should spend all that is available to it now and think of additional spending later when growth picks up.
Sen warns that without additional fiscal spending now would mean the GDP growth would be negative in this fiscal (FY21) as well as in the next (FY22), dragging India into a depression.
He says the negative growth of this fiscal year would have a multiplier effect and exports are likely to be hit hard as the global economy slips into a recession, jeopardising growth in FY22.
But where would the money for additional spending come from?
Here, Sen says, the excess liquidity generated by the RBI would help.
The government could issue bonds to tap this liquidity and finance its spending.
Should the yield on bonds (currently around 6%) go beyond the comfort zone (7.5%, in his reckoning), the government could monetise the rest by going to the RBI.
Seen from this perspective, the excess liquidity sitting idle now could be put to productive use and stimulate growth.

Rebooting Economy 70: The Bombay Plan and the concept of AatmaNirbhar Bharat

  The Bombay Plan, authored by the doyens of industry in 1944 first envisioned state planning, state ownership and control of industries to ...