Friday, February 5, 2021

Rebooting Economy 60: India in a financial mess of its own making

 Misdirected stimulus that relies heavily on liquidity infusion when demand is depressed and incentivising loan defaults by routinely writing off NPAs threaten financial stability and economic recovery

twitter-logoPrasanna Mohanty | January 21, 2021 | Updated 11:47 IST
Rebooting Economy 60: India in a financial mess of its own making
The Insolvency and Bankruptcy Code (IBC) is unlikely to help much in cleaning up bad loans

The RBI's Financial Stability Report (FSR) released on January 11, 2021 warns of serious financial risks to the economy (described as "unintended consequences") caused by the monetary and fiscal measures pursued to revive the economy.  

It says the financial vulnerabilities "incipiently pre-pandemic" have "intensified" and "pose headwinds to a fuller recovery". Its macro stress tests show that the Gross NPA (GNPA) ratio of Scheduled Commercial Banks (SCBs) is likely to rise from 7.5% in September 2020 to 13.5% by September 2021, under the baseline scenario, and 14.8% under the severe stress scenario indicating "possible economic impairment".  

What does the worsening GNPA ratio mean?  

Macro-financial risks to the economy  

The RBI's Report on Trend and Progress of Banking in India, 2019-20, released on December 29, 2020 says in FY20, the GNPA ratio of the SCBs was 8.2% and the total GNPA was Rs 9.15 lakh crore. At this rate, 13.5% to 14.8% GNPA ratios would translate to Rs 15 lakh crore-Rs 16.5 lakh crore of stressed assets in the SCBs.

This would mean further reluctance by banks to provide long-term credit for investment.

Also Read: Rebooting Economy 59: Quantum jump in fiscal spending is what India needs immediately

In addition to deterioration in the SCBs' asset quality, the RBI report flags two more worrying aspects: (i) capital buffers in the SCBs likely to fall "below the regulatory minimum" and (ii) "the disconnect" between some segments of financial markets (like the booming stock market) and the real economy "has been accentuated" and the stretched valuations of financial assets "pose risks to financial stability".  

If the current monetary and fiscal policies are pursued for a longer period, it warns that authorities would "eventually" be locked into "forbearance and liquidity traps".

The RBI Governor Shaktikanta Das' advice (in the foreword): "Banks and financial intermediaries need to be cognisant of these risks and spill-overs in an interconnected financial system."  

Inter-connectedness of financial institutions makes it easier for the malaise to spread to the entire financial system, thus posing a macro-financial risk to the economy.

What this report ignores is that India is already in a liquidity trap and that the RBI has played a major role in this. Until October 31, 2020, RBI facilitated Rs 12.7 lakh crore of liquidity through various instruments.  

A substantial part of this liquidity gets parked in its own reverse repo account daily as banks prefer the safety and assured interest earning of 3.35% of such deposits, instead of lending to businesses, which have little need for credit in an economy hit by demand depression in any case.

Also Read: Rebooting Economy 58: The untold story of India's services sector

The following graph maps the daily deposits in RBI's reverse repo account from January 1 to November 21, 2020.

Notice how the deposits rose sky-high in response to the RBI's cheap credit after the lockdown. The repo rate (at which the RBI lends to banks) came down from 5.15% until March 26, 2020 to 4% in May 2020 where it stands now.

Spree of writing off loans (NPAs) to private companies

The other negative fallout of persisting with the current monetary and fiscal policy that the RBI flagged off is locking authorities into "forbearance".  

Here "forbearance" stands for the moratorium on loan repayment, freezing of classifying bad loans as NPAs and restructuring of loans declared during the lockdown. When these measures are withdrawn, the RBI warns that the GNPA ratio is likely to jump from 7.5% to 13.5% and 14.8% at different stress levels.

Also Read: Rebooting Economy 57: When and how will industry take India to next level of growth?

The RBI does not explain why huge amounts of loans availed by private businesses are routinely being written off and banks are recapitalised with public money in compensation, thereby incentivising more loan defaults. The RBI has stopped even providing data on NPA write-offs in its database. It zealously guards the identities of big loan defaulters too.  

In August 2020, it provided year-wise NPA write-offs from FY04 to FY20 (up to December 31, 2019) in response to an RTI query from a Pune-based businessman, Prafful Sarda. The RBI's banking trend report of 2019-20 mentioned earlier provides the total NPA write-off for the full fiscal year of FY20.  

The following graph uses these disclosures to show how loan write-offs by the SCBs and public sector banks (PSBs) dramatically increased during the past six years since the NDA-II came to power. As against Rs 2.2 lakh crore during the 11 years between FY04 and FY14, the loan write-offs went up to Rs 8.7 lakh crore in six years between FY15 and FY20 - 4 times.

Notice, the PSBs account for the bulk of loan write-offs (76.5% of the total) and are compensated for it periodically with public money.

Much has been made of the recovery of written off NPAs.

Also Read: Rebooting Economy 56: Why India should follow agricultural development-led industrialisation growth model

The graph below maps the NPA write-offs and their recoveries by the SCBs between FY15 and FY20 (up to December 31, 2019) using the RBI's 2020 RTI reply mentioned earlier.  

The total recovery is less than 10% of the total NPA write-offs. (The RTI reply did not give any information on recovery before FY15.)

The Insolvency and Bankruptcy Code (IBC) is unlikely to help much in cleaning up bad loans. Former RBI Governor Urjit Patel disclosed in his book "Overdraft: Saving the Indian Saver" that the central government diluted the code and the RBI's powers to undermine efforts to clean up the bad loan mess (NPAs). This led to his eventual resignation from the RBI in December 2018.  

In view of all this, the current governor's advice to banks and financial intermediaries "to be cognisant" of macro-financial risks to the economy is uninspiring.

Also Read: Rebooting Economy 55: Farmer producer organisations best bet for small, marginal farmers

Is further recapitalisation of banks on cards?

The RBI's FSR does not talk about recapitalisation of banks. Between FY15 and FY20, the government has pumped in Rs 3.16 lakh crore of public money for this (compensate banks writing off loans).

But Arvind Panagariya, former Niti Aayog deputy chairman, does seek this. In an article headlined "Four Recommendations for FM", he strongly recommended the finance minister to "recapitalise in advance the public sector banks (PSBs) on a sizable scale" in her forthcoming budget.  

His logic: In its first term (2014-2019), the NDA-II government was slow to act on the NPAs front, as a result of which "the economy paid a high price for it" with both credit and GDP growth slipping. He expects a rise in NPAs once the "forbearance" is lifted, hurting growth in credit and GDP, and hence the recommendation.

Also Read: Rebooting Economy 54: Will bypassing APMC-based procurement improve farmers' income, ensure food security?

Given the intellectual heft Panagaiya enjoys with the NDA-II government, his advice can't be dismissed lightly. Although it is not clear how recapitalisation of banks will help credit and GDP growth when (i) excess liquidity with banks is daily parked in the RBI's reverse repo account and (ii) without addressing bad loans/loan defaults that leads to financial stress and lower credit growth, unless the idea is to write off more loans of private businesses.

As for credit growth, the FSR further points out that while bank credit growth (YoY) has declined in FY20 and remains sluggish since then, deposit growth has been robust (in the double digits) "reflecting precautionary saving in the face of high uncertainty".

Also Read: Rebooting Economy 53: Why crop insurance is losing traction in India

Does credit growth matter in the current situation?

The RBI's FSR provides evidence of what ails the economy.  

It presents a table - reproduced below - listing "major impediments to a robust economic recovery post COVID-19" its systemic risk survey (SRS) revealed.

What the table suggests is the need for high fiscal spending to revive demand and kick-start the investment cycle as well as framing of policies to address issues like supply chain disruptions, workforce reduction/employee stress, lower productivity etc., rather than a need to boost credit growth as Panagariya tells the finance minister. 

Also Read: Rebooting Economy 52: The unfinished agenda of land reforms nobody talks about

Also read: Rebooting Economy 51: Where is India's vision, plan for sustained agriculture growth and farmers' welfare?

Also Read: Rebooting Economy 50: Economic reforms for whom and for what?


Rebooting Economy 59: Quantum jump in fiscal spending is what India needs immediately

 First advance estimates of national income highlight three key imperatives to revive growth: generate demand and investment cycles by directly spending more and reverse import substitution

twitter-logoPrasanna Mohanty | January 18, 2021 | Updated 11:31 IST
Rebooting Economy 59: Quantum jump in fiscal spending is what India needs immediately
The estimates for FY21 further show that, three out of two components of industry, 'mining and quarrying' and 'manufacturing' will have minus 12.4% and minus 9.4% growth

Less than a fortnight to go before the FY21 budget presentation, the state of Indian economy does not look good, notwithstanding the hypes around "faster than expected", V or K-shaped recovery or "a never before budget". For any such change to happen, India needs a drastic course correction that may be easier said than done in a top-down polity.

Here is first what the First Advance Estimates of National Income, released on January 7, 2021, indicate about the growth prospects beyond FY21.

Both demand and investment are down and out

The following graph uses the National Accounts Statistics (NAS) 2020 and the First Advance Estimates of National Income (AE1) 2020-21 to map the growth trends in three key financial expenditure components of the GDP - private final consumption expenditure (PFCE), government final consumption expenditure (GFCE) and gross fixed capital formation (GFCF) - along with that of the GDP (all at constant prices).

What the graph shows is that private consumption (PFCE) and investment (GFCF), the two constituting 87-89% of the total expenditure GDP in FY19 and FY20, will touch a new low in FY21 with their growth rates plunging to minus 9.5% and minus 14.5%.

Also Read: Rebooting Economy 58: The untold story of India's services sector

In itself, this plunge wouldn't be a big worry had their growth been better in earlier fiscals. Growth in private consumption had fallen from 8.1% in FY17 to 5.3% in FY20 (PE). Similarly, growth in investment had fallen from 8.5% in FY17 to minus 2.8% in FY20(PE).

These trends show that a dramatic reversal is unlikely in the short run, and since they contribute 87-89% to the GDP, a quick reversal in GDP growth is not likely either.

The two GDP components to register positive growth in FY21 are government expenditure (GFCE) and net exports. The latter is not something to cheer about.

As for government expenditure (both Centre and states), the optimistic projection in growth seems to run counter to Q1 and Q2 data of FY21, which have already been released. The Q2 data (released in November 2020), had shown a 25% fall compared to Q1 of FY21, which was shocking since by the time Q2 started (July, August and September) the unlocking was already a month old.

The central government's total spending in the first six months (Q1 and Q2) of FY21 was less than that of FY20 - Rs 14.8 lakh crore of FY21 against Rs 14.9 lakh crore of FY20 - according to the data released by the Controller General of Accounts (CGA). Capital expenditure was consistently lower in the three months of Q2 of FY21 against Q2 of FY20. (For more read "Rebooting Economy 47: Do India's fiscal numbers suggest a quick turn-around? ")

How would the growth in GFCE turn a highplus 5.8% in FY21 is a mystery.

Also Read: Rebooting Economy 57: When and how will industry take India to next level of growth?

What a positive growth in government expenditure (GFCE), however, means is that only one engine is working, as should have been anticipated because a recessionary trend had already set in before the pandemic hit. That is what prompted eminent economists like Abhijit Mukherjee and Raghutam Rajan to repeatedly ask the government to increase fiscal spending, which was ignored.

The AatmaNirbhar Bharat packages did the reverse. It had very little fiscal spending or government expenditure (1-2% by most estimates), the rest being credit and credit guarantee schemes. Going by the growth estimates for investment (GFCF) in FY21 (minus 14.5%) the AatmaNirbhar Bharat failed to kick-in credit intake, as had been forewarned. It was a typical supply side solution to a demand side problem.

The RBI's monthly bank credit to non-food sector shows how much it has steadily gone down in the past two years. The government would have known this very well since this high-frequency data is available on fortnightly basis too.

Investment is directly linked to demand. The finance ministry had warned about demand slowed down way back on May 1, 2019 with its Monthly Economic Report for March 2019.

The untimely and unplanned lockdown rendered millions jobless and shut millions of businesses, particularly small businesses, drastically reducing income and consequently, demand in the economy. Despite the slump, as shown in the graph, in private consumption, it would still be accounting for 56% of the GDP in FY21.

Also Read: Rebooting Economy 56: Why India should follow agricultural development-led industrialisation growth model

Unless jobs are restored and small businesses restart, demand/consumption is unlikely to revive or drive growth. The key bottleneck in this is that the government has no idea how many lost jobs and businesses shut. It did not, and has not, collected the requisite information and hence, the budget will be designed in a complete information vacuum.

Since the credit and credit guarantee schemes have failed to generate demand, the obvious way to go forward is direct cash support to the poor who lost jobs and their small businesses due to the cumulative impact of the lockdown, demonetisation and GST.   

Imports tumble, fall below exports for third time since 1970-71

The only component of the expenditure GDP left out so far is net export (export minus import), and for good reason.

India's trade balance (export minus import) has been negative, plunging to lower depths with each passing year since 1970s for which the RBI provides data. There were two exceptions to this, one in 1972-73 and 1976-77. The following graph maps the trend.

Also Read: Rebooting Economy 55: Farmer producer organisations best bet for small, marginal farmers

The estimates for FY21 show a third positive balance.

The question that needs to be asked is why this would happen.

The following graph, using the First Advance Estimates on National Income data, gives the answer.

Imports will plunge below exports in FY21.

Why this is not a good news

Firstly, a fall in imports re-emphasises weakening of domestic demand.

Secondly, imports constitute 32.5% of India's exported goods and services (called 'import intensity of exports') for the whole economy, and 51% for manufacturing goods. A fall in imports is, therefore, counter-productive and would eliminate the possibility of export-led growth that China and other developed countries have seen. (For more read "Rebooting Economy 47: Do India's fiscal numbers suggest a quick turn-around?")

The import-substitution policy embodied in AatmaNirbhar Bharat will take India further down this path, which is why all economists, including the government' loudest cheerleader Arvind Panagariya, have opposed this failed policy of 1960s and 1970s.

Also Read: Rebooting Economy 54: Will bypassing APMC-based procurement improve farmers' income, ensure food security?

Why was this policy adopted then?

The short answer is to ensure assured businesses for domestic companies and protect them from outside competition, as was the case in 1960s and 1970s. That policy ended in a failure and there is no reason why the same wouldn't happen again. Former Chief Economic Advisor Arvind Subramanian has argued that India needs exports for growth since the domestic market is not big enough to provide a big enough lift. (For more read "Rebooting Economy 45: What is AatmaNirbhar Bharat and where will it take India? ")

Agriculture isn't big or powerful enough to drive India's growth

The following graph maps the growth in three sectors of the Indian economy.

Notice, the only positive growth in FY21 is seen in agriculture (plus 3.4%). Industry and services are expected to plunge to minus 8.5% and minus 9.2%, respectively.

Notice also how the growth in agriculture has fluctuated the most (dropped to zero or near zero in FY13, FY15 and FY16) because it is weather-dependent.

Agriculture can't drive India's growth.

Its average annual growth is 3.3% during FY13 and FY20; its contribution to the GDP fell below 15% since FY19 and its average annual contribution to the GDP growth is 10.3% during FY12 and FY20.

Also Read: Rebooting Economy 53: Why crop insurance is losing traction in India

The estimates for FY21 further show that, three out of two components of industry, 'mining and quarrying' and 'manufacturing' will have minus 12.4% and minus 9.4% growth. That manufacturing is in trouble is evident from high-frequency data on industrial production (IIP), particularly those relating to the core sector. Lack of demand has lowered industrial production and capacity utilisation for years now. In fact, manufacturing growth was 0.03% in FY20 (PE) when the GDP growth was 4.2%. (For more read "Reality check: Corporate tax cut unlikely to increase investment or employment ")

In services, all four components are expected to register negative growth - ranging from minus 0.8% to minus 21.4%. The AatmaNirbhar Bharat packages ignored the services in providing fiscal support. If it gets no support, it is unlikely to jump back to 5% growth that it had recorded in FY20. (For more read "Rebooting Economy 58: The untold story of India's services sector ")

Also Read: Rebooting Economy 52: The unfinished agenda of land reforms nobody talks about

How will India regain its growth momentum?

The answer is obvious and known for long: Direct cash support to the poor to revive consumption demand and higher fiscal spending to kick-start the investment cycle.

Enough has been written and said by leading economists of the world to debunk the neoliberal idea of 'fiscal austerity', which is more about politics and less about economics, for India to be trapped forever in the face of grave economic crisis. (For more read "Coronavirus Lockdown XVII: The economics behind India's Rs 21 lakh crore package " & "Deconstructing Neoliberalism II: How neoliberal ideas can wreak havoc on economies ")

The other obvious answer is to reverse the import substitution policy that embodies the AatmaNirbhar Bharat. Only then will the next budget truly be "a never before" one.

Also read: Rebooting Economy 51: Where is India's vision, plan for sustained agriculture growth and farmers' welfare?

Also Read: Rebooting Economy 50: Economic reforms for whom and for what?

Rebooting Economy 58: The untold story of India's services sector

 It is an unending saga of gross negligence despite the services sector being the main driver of India's growth story; contributes the most to GDP and is arguably the largest employer too

twitter-logoPrasanna Mohanty | January 13, 2021 | Updated 12:11 IST
Rebooting Economy 58: The untold story of India's services sector
Unlike other sectors of economy, there is a paucity of literature on services not just in India but globally, reflecting poor faith of economists in its ability to drive growth

How neglected is India's services sector can be easily determined by asking a simple question to policymakers, planners, or economists: What was the services sector's contribution to the GDP in 1950-51?

It is highly unlikely that anyone would even guess it right: 36%. Its contribution then was next to agriculture but it surpassed agriculture in mid-1960s, crossed 50% in mid-1960s, zoomed past 60% in FY05, and continues its lofty perch since then. It has also been the main engine of India's growth for several decades and, going by the International Labour Organisation (ILO) projections, it became the largest employer in 2019 (closest to India's FY20), surpassing agriculture.

Yet there is no national policy, department, or ministry dedicated to services or national debate on it. It has grown virtually on its own, as India's IT sector would vouchsafe. But before going further, here is a reality check.

Also Read: Rebooting Economy 57: When and how will industry take India to next level of growth?

The invisible sector that contributes the most to GDP

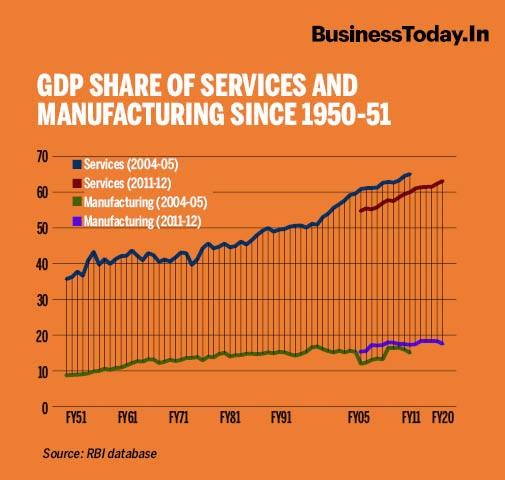
The following graph maps the GDP share of services and manufacturing since 1950-51 using the 2004-05 and 2011-12 GDP series at constant prices.

Why this comparison with manufacturing?

That's because traditionally economic growth is associated with manufacturing, not services. The developed nations of the west (like the UK, US, Germany, and others) and the success stories of the east (Japan, South Korea, China, and others) have had a manufacturing-led high growth story.

In sharp contrast, India's growth story has been riding on services for several decades, but that has made little difference to the perceptions of policymakers, planners, and economists.

Also Read: Rebooting Economy 56: Why India should follow agricultural development-led industrialisation growth model

The remarkable element of the above graph is the huge gap in the contribution of services and manufacturing to the GDP. In the 2004-05 GDP series (constant prices) the services' share was four times more in 1950-51 and increased to 4.3 times in 2013-14. After the new series (2011-12) was introduced and some sub-components of 'Trade, Hotels, Transport and Communication (THTC)' were shifted from services to manufacturing, raising the latter's share, the services' share of the GDP was still 3.6 times more than manufacturing's in 2019-20.

Services is the main driver of India's growth

When it comes to sectoral contributions to the GDP growth, the services sector provides the maximum thrust.

Between 1950-51 and 2013-14, its annual average contribution to the GDP growth was 54.4% (2004-05 series at constant prices). Between 2011-12 and 2019-20, its contribution to the growth increased to 67.7% (2011-12 series at constant prices).

In sharp contrast, the manufacturing sector's contribution was 13.1% and 18.1% for the corresponding periods.

Services is the largest employer too

In 2019 (closest to India's FY20), services surpassed agriculture for the first time as the largest employer, according to the ILO's projections, which even the RBI and Economic Surveys use in their reports because no government agency provided such estimates after the Planning Commission was dismantled in 2014.

According to the ILO database, services provided employment to 44.2% of the total employment in 2019 as against agriculture's 43.2%. In contrast, manufacturing's share was just 11.4%.

Also Read: Rebooting Economy 55: Farmer producer organisations best bet for small, marginal farmers

The earlier years' sectoral shares of employment have been taken from the Planning Commission and Economic and Political Weekly's December 1966 issue.

Global bias against the services sector

Unlike other sectors of economy, there is a paucity of literature on services not just in India but globally, reflecting poor faith of economists in its ability to drive growth.

A World Bank's working paper released in 2014, "Can Service Be a Growth Escalator in Low Income Countries?", tried to explain this while endorsing its role as the main growth engine. It said: "It has been argued for more than 200 years that economic growth is associated with the manufacturing sector. Services have been considered non-tradable, menial, low productivity, and low-innovation."

It sought to impress that the conventional path of manufacturing-led growth and development seems to have hit a roadblock in many parts of the world, especially in low-income countries in Africa and South Asia. Some of these countries, like the Lions of Africa (Tanzania and Ethiopia) and India have witnessed growth driven by services, unlike the East Asian Tigers or the western developed economies.

Also Read: Rebooting Economy 54: Will bypassing APMC-based procurement improve farmers' income, ensure food security?

The working paper does not argue that services is superior to manufacturing in driving growth, or the other way round, but that the latecomers to development now have more levers to pull because of globalisation and the Third Industrial Revolution that brought information technology (IT) and information communications technology (ITC).

It argued that the Third Revolution led by services can upset five long-held tenets of economic development: (i) traditional thinking that the services sector is a product of growth and can't drive growth on its own is no longer valid; services can be produced and traded just like manufacturing goods and is contributing more than manufacturing to growth and jobs in both low and high-income countries (ii) global trade in services has exploded and is growing faster than trade in goods (iii) technology, trade, and supply chains have changed services from being lower in productivity than manufacturing; innovation in communication and transport have contributed to global supply chain in services just like in manufacturing (iv) it is no longer true, in both low and high-income countries, that goods jobs are created only in manufacturing and (v) services-led growth is also compatible with greener, inclusive and more gender-friendly growth.

How India treats its services sector

India belatedly recognised the services' sector's contributions and is yet to devote time or energy to develop it.

The earliest recognition perhaps came with the working paper published by the Asian Development Bank (ADB) in 2013, which is well reflected in its title, "The Service Sector in India".

It said: "The service sector is the largest and fastest growing sector in India and has the highest labour productivity, but employment has not kept pace with the share of the sector in gross domestic product and has not produced the number or quality of jobs needed. There is no policy leading to inclusive growth, and multiple, uncoordinated governing bodies adversely affect the growth of the sector...

Also Read: Rebooting Economy 53: Why crop insurance is losing traction in India

"Most of the poor in India do not have access to basic services such as healthcare and education and infrastructure is weak so the cost of service delivery is high. Although India wants to be a knowledge hub, there is no uniformity in the quality and standards of education and formal education does not guarantee employability. Policy measures are suggested for inclusive growth that will also enhance India's global competitiveness in services."

The 12th Five-Year Plan's Volume II (also published in 2013) was devoted to "Economic Sectors", but did not even have a chapter on services. Various components of the service sector were treated as adjuncts to eight sectors, each of which had a dedicated chapter: Agriculture, industry, energy, transport, communication, rural development, urban development, and other priority sectors.

The Economic Survey of 2019-20 devoted an entire chapter to services and said, among others: (a) the services sector's significance in the Indian economy has continued to increase with it contributing around 55% of the total size of the economy and GVA growth (b) its share exceeds 50% of Gross State Value Added in 15 out of 33 states and UTs and more than 80% in Delhi and Chandigarh (c) it accounts for two-thirds of total FDI inflows and 38% of total export and (d) services' exports have outperformed goods export in recent years, raising India's share in world's commercial services exports to 3.5% in 2018, twice that of merchandise export at 1.7%.

It also recorded that high-frequency data and other economic statistics suggested "a moderation in services sector activity during 2019-20" with bank credit to the sector, air passenger traffic, and rail freight traffic witnessing "a deceleration".

It offered no solution, devoting the entire chapter to analysing the data for different components, other than expressing optimism for improvement.

Also Read: Rebooting Economy 52: The unfinished agenda of land reforms nobody talks about

That was not to be. The pandemic hit and the AatmaNirbhar Bharat packages of more than Rs 20 lakh crore also ignored it, in keeping with the traditional approach to the sector.

In August 2020, Geetanjali Nataraj, director of a central government body, Services Export Promotion Council (SEPC), wrote in a national daily with an apt sub-head "An Unserviced Sector".

In it, she wrote how the AatmaNirbhar Bharat packages had overlooked the plight of the services sector even though it was the main driver of India's growth and was "struggling hard to keep its head above water".

She issued a warning: "From tourism, aviation, shipping, space to call centres and delivery services, the standstill in activities is bound to have a knock-out effect on employment, production, and the economy as a whole. The big picture suggests that the current relief provisions for the primary and secondary sectors would also be nullified as a consequence of neglecting the tertiary sector (services)."

She also pointed out that due to this neglect, the services sector contracted for the fifth successive month in July 2020.

Also read: Rebooting Economy 51: Where is India's vision, plan for sustained agriculture growth and farmers' welfare?

How services would perform in FY21

Now that the 'First Advance Estimates of National Income 2020-21' is out, released on January 7, 2021, here is what Nataraj anticipated.

The National Statistical Office (NSO) estimates the overall GVA to shrink to minus 7.2% in FY21 (GDP to shrink to minus 7.7%).

About sectoral performances, it provides a mix picture. The agriculture-GVA and utilities-GVA (component of industry) would register positive growth (3% and 2.7%, respectively). The manufacturing-GVA (main component of industry) will shrink by minus 12.4%.

When it comes to services, all its four components will shrink.

Also Read: Rebooting Economy 50: Economic reforms for whom and for what?

The GVA of 'Financial, Real Estate, and Professional Services' will shrink to minus 0.8%, 'Public Administration, Defence and Other Services' to minus 3.7%, 'Construction' to minus 12.6% and 'Trade, Hotels, Transport, Communication, and Broadcasting' to minus 21.4% (all at constant prices).

How long will India ignore the services sector?

Rebooting Economy 70: The Bombay Plan and the concept of AatmaNirbhar Bharat

  The Bombay Plan, authored by the doyens of industry in 1944 first envisioned state planning, state ownership and control of industries to ...