Wednesday, November 4, 2020

Rebooting Economy 40: Why Punjab farmers burn stubble?

 Multiple factors led to it: First they were asked to grow paddy to overcome food scarcity; mechanised harvesting left massive residue that takes longer to decompose and then paddy sowing was delayed to conserve water, overshooting residue burning into Delhi's bad winter air days

twitter-logoPrasanna Mohanty | October 26, 2020 | Updated 09:18 IST
Rebooting Economy 40: Why Punjab farmers burn stubble?
Contrary to the claims of scientific papers, however, farmers of Punjab claim that they have been burning paddy stubble for decades, ever since they were encouraged by the government to grow it to overcome India's food shortage

While farmers of Punjab, Haryana and western Uttar Pradesh get annual drubbing over stubble burning (paddy residue called "parali" in local language) which pollutes Delhi's air during the winter months of October and November, very few know that they were forced into it.

Here is how.

Mechanised harvesting led to stubble burning  

There are many multi-institutional studies that say why and when stubble burning started in Punjab and neighbouring states.

Two credible studies - one led by NASA and published in July 2018 ("Crop Residue Burning in Northern India: Increasing Threat to Greater India") and another led by Harvard University and published in February 2019 ("Detection of delay in post-1 monsoon agricultural burning across 2 Punjab, India: potential drivers and consequences for air quality") - say it started in mid-1980s with the introduction of mechanised harvesting for wheat (April-May) and paddy (October-November).  

Also Read: Rebooting Economy 39: Why nobody questions industries polluting Delhi air the most?

Mechanised harvesting leaves taller and massive crop residue as against manual harvesting, which cuts crop close to the ground and leaves much less residue. A visit to Punjab and Haryana will show harvesters leaving out 1-2 ft tall stubbles, compared to less than 6 inches in manual harvesting.   

Contrary to the claims of scientific papers, however, farmers of Punjab claim that they have been burning paddy stubble for decades, ever since they were encouraged by the government to grow it to overcome India's food shortage. Later, mechanisation was also encouraged. Paddy residue left by harvesters takes one-and-half months to decompose while farmers don't have sufficient time to sow their next crop, wheat.  

(A 2018 photograph clicked in Punjab showing how mechanised harvesting leaves tall stubbles)

Stubble burning is a quick, cheap and efficient way to prepare soil bed for wheat, the next crop. There is yet another problem with paddy stubble which is why it needs to be burnt. Unlike other crop residues, paddy residue (except for basmati variety) are harder to chew, has low calorific value and high silica content, all of which makes it unsuitable for use as animal fodder.

Delhi's air pollution is not just because of stubble burning. There are multiple and far more critical factors, like Delhi's foggy winter conditions and low wind speed during October-November (when paddy stubble is burnt), high industrial and vehicular emissions and dust in and around it. (For more read "Rebooting Economy 39: Why nobody questions industries polluting Delhi air the most?")

Paddy intensification in Punjab in recent times

Paddy was not an important crop in Punjab in the pre-Green Revolution era but became one later. From a mere 7.1% of cropped area at TE (triennial ending) 1973, paddy cultivation expanded to 36% of cropped area at TE 2013 in Punjab. Procurement of paddy at the minimum support price (MSP), which provides an assured income to farmers, also helped to popularise it. In turn, the high water-intensive paddy shrunk Punjab's water table rapidly.

Also Read: Lockdown reduces Delhi pollution; air quality turns 'good' from 'hazardous'

The traditional method of flooding paddy fields with water works as a natural weedicide and hence, is a popular method of cultivating it and is more often sown in monsoon months across India.   

The Harvard study cited earlier says that in addition to mechanised harvesting, intensification of paddy cultivation in Punjab in more recent years has also led to higher incidents of stubble burning. A study led by Columbia's Universities Space Research Association, published in 2019 ("Connecting Crop Productivity, Residue Fires, and Air Quality over Northern India") quantified this intensification by using satellite images: 25% increase in rice production in Punjab during 2002-2016.

Delayed paddy sowing to conserve groundwater  

Another major factor often ignored is that Punjab and Haryana both enacted laws to protect their rapidly shrinking groundwater level by forcing farmers to delay sowing and transplantation of paddy from May to June.

Haryana notified The Haryana Preservation of Sub-soil Water Act of 2009 in March 2009, prohibiting nursery sowing and transplanting paddy until May 15 and June 15, respectively. It put a penalty of Rs 10,000 per hectare a month or a part thereof and cost of destroying sown or transplanted paddy on farmers.

Also Read: Delhi residents worry about toxic combination of coronavirus, pollution

Punjab notified an identical law, The Punjab Preservation of Subsoil Water Act of 2009 in April 2009, prohibiting nursery sowing and transplanting paddy until May 10 and June 16, respectively. Violations attract the same penalties as in Haryana.  

Punjab kept further delaying paddy transplantation. In June 2018, it was not allowed until June 20. Until then, Punjab's agriculture scientists say paddy transplantation was mostly confined to May.

How has this impacted stubble burning?  

The delayed sowing led to delayed harvesting and left very little time to ready soil bed for sowing wheat, forcing farmers to burn paddy residue in the field. The delayed stubble burning also meant that smoke from it got into Delhi at the worst possible weather conditions in late October to mid-November when air quality is very poor in any case. (For more read "Rebooting Economy 39: Why nobody questions industries polluting Delhi air the most?")

A 2019 study led by India's International Maize and Wheat Improvement Centre (IMWIC) looked at the trade-off between water conservation move and air pollution ("Trade-offs between groundwater conservation and air pollution from agricultural fires in northwest India").

It found, in Punjab 86% paddy was planted on or before June 28 for six years (2003 to 2008) prior to the water conservation law, which fell to 40% in 2009 and thereafter. Accordingly, paddy harvesting shifted to a later period: from about 40% harvesting before October 26 during 2003-2008 to 14% in 2009 and thereafter. The impact in Haryana was less pronounced since the short-duration basmati (aromatic) grown here was sown later even earlier.

Also Read: Rebooting Economy 38: What makes stock markets and billionaires immune to coronavirus pandemic?

The study also found that following the water laws stubble burning declined in the last fortnight of October but "significantly increased" in the first three weeks of November - a time when Delhi's temperatures are lower by 3 degree Celsius and wind speed is weak, which discourages dispersal of air pollutants, compared to the second fortnight of October. Consequently, the average PM2.5 concentrations in November were found to be 29% higher in post-water conservation laws, it added.

The 2019 Harvard study cited earlier reached similar conclusions: "We find that the peak fire intensity of the post-monsoon burning season in Punjab has shifted later in time by over two weeks from 2003 to 2016, with a 40% increase in overall fire intensity."  

It found "high fire intensity days preferentially occur during the latter half of the fire season, when the optimal window for sowing is shrinking". It concluded: "First, a shortened harvest-to-sowing period may further encourage farmers to burn crop residues in order to sow winter wheat on time. Second, the timing of peak crop residue burning may increasingly coincide with winter meteorology that favours severe smog events downwind across the IGP (Indo-Gangetic Plain), where we diagnose a 50% increase in AOD (a measure of surface PM2.5 concentrations) of exceedances..."

Solutions to stubble burning

In the last two years, however, things have changed a bit.  

The delayed sowing has been temporarily reversed a bit in the 2019 and 2020 Kharif season for reasons other than water conservation or air pollution.

In 2019, the Punjab government advanced paddy transplantation to June 13, from June 20 set earlier, because farmers complained of high moisture content in the crop due to late sowing (which delays harvesting and lowers paddy price in mandis). When this was challenged, the National Green Tribunal (NGT) upheld the change, although justifying it as a move that would reduce Delhi's air pollution.

In June 2020, Punjab again advanced paddy transplantation, first to June 13 (from June 20) and then to June 10 as farmers wanted more time due to labour shortage caused by the pandemic-induced reverse migration.

Consequently, paddy harvesting has been early in 2020 but not in 2019. A senior Punjab Pollution Control Board (PPCB) official said Punjab received rain in September 2019 which delayed harvesting.

The first solution to reducing stubble burning (and save Delhi's air) is, therefore, to go back to the earlier cropping pattern (that existed before 2009) but that is easier said than done because of progressively falling groundwater level in Punjab.

Also Read: Rebooting Economy 37: Do high-frequency data suggest V-shaped recovery?

The second solution is to promote short-duration crops, like basmati (PB1509) as is popular in Haryana, which have a maturity period of 85-90 days, instead of 110-120 days for non-basmati ones. This too is easier said than done because basmati is not procured at MSP, thereby denying farmers an assured income and dis-incentivising its use.

Third is to win away farmers from growing paddy altogether to restore the earlier diversified cropping pattern. That too is not easy because procurement at MSP is confined to wheat and rice, not pulses, vegetables, fruits or other crops, even though MSP is announced for 23 crops every year.

Fourth is to adopt technology. Punjab farmers are increasingly using various techniques and equipment to avoid stubble burning: direct seeding of wheat without removing paddy stubble, including by using Happy Seeders and cutting and mixing paddy stubble with soil using Rotavators and Mulchers. In this case, there is always a shortage of equipment.

Punjab farmers are also not happy with such experimentation because they say these techniques don't work for paddy stubble because (i) it takes more than a month to decompose and mix with soil even then (ii) provides ideal breeding ground for rats and termites that damage their crops and (iii) adversely impacts wheat germination, leading to significantly lower yields.

Fifth is to encourage alternate use of paddy stubble: making paper and packing materials, generating energy (or using in cement plant) and making composts. Hay Baler machines that compress crop residue into bales can be spotted in Punjab and Haryana during this time of the year but are prohibitively costly for farmers.  

Also Read: Rebooting Economy 36: Job creation is nobody's business in India

Composting stubble is an idea that has not found farmers' favour, in spite of years of government efforts. The liquid decomposer solution, recently developed by the Indian Agriculture Research Institute (IARI) at Pusa and being promoted by the Delhi government, is the latest in the list of alternatives which is yet to travel beyond its borders.

There is more to stubble burning than Delhi's air pollution  

It is often ignored that stubble burning's impact goes far beyond Delhi.

A 2018 study by NASA ("Crop Residue Burning in Northern India: Increasing Threat to Greater India") looked at satellite images and ground-based sources during 2003-2017 and concluded: "...an increasing impact of CRB (crop residue burning) over the eastern parts of the Indo-Gangetic Basin and also over parts of central and southern India. The increasing trends of finer black carbon particles and greenhouse gases have accelerated since the year 2010 onward..."

The health implications of stubble burning are for those living in eastern, central and southern India as well.

Further, stubble burning has serious implications for climate change (along with pollution caused by industries, vehicles and other such sources).

Also Read: Rebooting Economy 35: Is fixed term employment a boon or bane for India's workforce?

A NASA explanatory note on "biomass burning" says pollution caused by it has both long- and short-term effects on Earth's atmosphere and climate system. Such burning releases greenhouse gases, like carbon dioxide, nitrous oxide and methane, which cause global warming.

Stubble burning is not the only problem for Delhi's air pollution or limited to October-November period. It is a year-round phenomenon, outside stubble burning.

The air quality index (AQI) that the government's System of Air Quality and Weather Forecasting and Research (SAFAR-India) tracks daily takes into account concentrations of eight pollutants - PM2.5, PM10, carbon monoxide, nitrogen dioxide, sulphur dioxide, methane and lead. The combined concentrations of all eight pollutants go into preparing the daily AQI, which is then classified into six categories to define the quality of air, ranging from "good" (0-50) to "severe" (more than 400).

Also Read: Rebooting Economy 34: Temporary jobs hurt both workers and economy

The Central Pollution Board (CPCB) was asked by the NGT to prepare AQI reports for Delhi and NCR for the months of March, April and May 2018 - some of the cleanest air quality months in Delhi. (NB: January to August are the cleanest air quality months in Delhi).

Here are the CPCB's findings.

  • March 2018: No single "good" AQI day in Delhi or in any of six NCR cities;
  • April 2018: Not a single "good" AQI day in Delhi; of six others only Alwar had 2 such days
  • May 2018: Not a single "good" AQI day in Delhi or in any of six NCR cities.  
  • More than 50% days during this period (54 out of 92 days), Delhi's air was marked "poor" and "very poor".

Also Read: Rebooting Economy 33: Where have the good old full-time decent jobs gone?

A SAFAR-Delhi's report - "The year that was (2019) & how it faired w.r.t. last year (2018)" - says there were 130 days of "poor", "very poor" and "severe" AQI days in Delhi in 2019 and in 2018, there were 153 such days.

The following graph maps all six categories of AQI days in Delhi in 2019 and 2018 from this report.

Also Read: Rebooting Economy 32: Wage code leaves millions of workers out in cold

Also Read: Rebooting Economy 31: Will new labour codes protect more workers or less?

Also Read: Rebooting Economy XXX: Rural India in far deeper crisis than what govt data claims

Rebooting Economy 39: Why nobody questions industries polluting Delhi air the most?

 Many studies, including those by top government bodies, identify top polluters of Delhi air as industries, vehicles and dust; the annual, ritualistic bashing of Punjab farmers in winter months only helps in shifting the blame and allows government agencies to evade accountability

twitter-logoPrasanna Mohanty | October 22, 2020 | Updated 19:07 IST
Rebooting Economy 39: Why nobody questions industries polluting Delhi air the most?
There is more to Delhi's air pollution than stubble burning, industrial and vehicular emissions and dust. Those are geographical and meteorological factors

It is that time of the year when India ritually engages with Delhi's air pollution, primarily focussing on stubble burning in Punjab, although Haryana and western Uttar Pradesh also contribute to it. Once Diwali is over, everything goes back to normal, as if air pollution is limited only to winter months of October and November.

That air pollution kills more than a million Indians a year; that it is a year-round phenomenon or that it has serious consequences for climate change don't figure in this brouhaha.

This ritualistic bashing of farmers continues year after year because it helps authorities responsible for pollution control in multiple ways: (i) it diverts attention from far bigger sources of air pollution (stubble burning is not one of those) (ii) shifts blames to farmers and (iii) gives those who need to be questioned and held accountable a free passage.

Also Read: Lockdown reduces Delhi pollution; air quality turns 'good' from 'hazardous'

First, why air pollution matters.

Air pollution kills a million Indians a year

Air pollution kills millions worldwide every year in which India and China figure at the top. The focus of global and national studies on air pollution is smaller particulate matter PM2.5 (particle size of 2.5 microns or smaller) because these are the ones that enter lungs and other parts of body easily and deeply, posing serious threat to life.

The State of Global Air (SoGA) 2020, released on October 21, 20201 by US-based think tank Health Effects Institute (HEI) and the Institute for Health Metrics and Evaluation's (IHME's) Global Burden of Disease (GBD) project, says ambient (outdoor) PM2.5 killed 4.14 million worldwide in 2019. In India witnessed 980,000 deaths attributable to ambient (outdoor) PM2.5. China saw 1.42 million such deaths.

In January 2019, medical journal Lancet published a study showing that air pollution (both indoor and outdoor) claimed 1.24 million Indian lives in 2017 alone, or 12.5% of the total deaths that year. It said the life expectancy of Indians would have been 1.7 years more had India's air quality been better.

The study found the concentration of PM2.5 in outdoor air higher in Uttar Pradesh, Haryana, Delhi, Punjab and Rajasthan, while those in indoor air (caused by firewood burning) were higher in Chhattisgarh, Rajasthan, Madhya Pradesh and Assam.

When the findings were first reported, the then environment minister (now health minister) Dr. Harsh Vardhan, a professional medical practitioner, dismissed them, saying that he did not agree that air pollution kills people. In his view it merely affected health.  

Also Read: Delhi residents worry about toxic combination of coronavirus, pollution

What are the top sources of Delhi's air pollution?

Several studies on Delhi's air pollution have been published in recent years. The findings common to all these are: (i) stubble burning is seasonal, restricted to a few days of October and November (ii) in overall contribution to air pollution the share of stubble burning or biofuel/biomass is insignificant and (iii) the major sources of air pollution are industrial and vehicular emissions and dust.

Premier environmental research body TERI carried out "source apportionment" or identification of sources of PM2.5 and PM10 in Delhi's air (and NCR), which was published in August 2018, titled "Source Apportionment of PM2.5 & PM10 of Delhi NCR for Identification of Major Sources". Air samples and satellite images were collected in 2016.

The following table, an extract from this report, shows the sources of PM2.5 and PM10 (particle size of 2.5 micron or less and 10 micron or less, respectively) in Delhi's air - in winter and summer months.

The top sources of PM2.5 in winter months were: Industry (30%), Transport (28%), Dust (17%), Others (11%) and Residential (10%). "Others" includes generator sets, refuse burning, crematoria, airport, restaurants, incinerators, landfills etc. and "Industry" includes power plants (stacks, fly-ash ponds and coal handling units), brick manufacturing, stone crushers, and other industries.

Similar are the findings for PM2.5 in summer months. The findings for PM10 are no different.

"Agri Burning" here refers to burning of agricultural residues (stubble burning) - both local and transported from outside Delhi (stubble burning in Punjab and elsewhere) - which contributed the least: 4% in winters and 7% in summers to both PM2.5 and PM10.

The report took account of stubble burning and said: "...the burning of agricultural residues in the farms of Punjab, Haryana, and Uttar Pradesh also contribute significantly in specific seasons."

Also Read: Rebooting Economy 38: What makes stock markets and billionaires immune to coronavirus pandemic?

A 2018 study by the government's own System of Air Quality and Weather Forecasting and Research (SAFAR-India), titled "High Resolution Emission Inventory of Major Air Pollutants of Mega City DELHI for 2018 under SAFAR", prepared an "emission inventory", the first step to "source apportionment" that the TERI did.

It showed that annuallybio-fuel burning (residential cooking, trash burning, household wood burning etc.) contribute only 3% to PM2.5 emissions. This study did not prepare "source apportionment" and excluded measuring contribution of external sources (stubble burning in Punjab, Haryana and Uttar Pradesh) but looked at local factors.

The maximum emissions of PM2.5 came from transport (41%), dust (21.5%) and industry (18%).

There are several studies that prepared "emission inventory" to identify and address the local causes of Delhi's air pollution and ignored season and episodic phenomenon of stubble burning in Punjab and other neighbouring states, since Delhi's air remains above acceptable pollution levels for most indicators throughout the year.

Why polluting industries never questioned?

The obvious question that arises from these findings is: Why industry is never questioned or blamed for Delhi's air pollution in spite of it being the top contributor?

Also Read: Rebooting Economy 37: Do high-frequency data suggest V-shaped recovery?

Other contributors (vehicular emissions and dust) have attracted the attention of authorities and courts and mitigating measures have been launched, even though episodically, but polluting industries have never been questioned or asked to mend their ways. They always get a safe passage.

Apart from directly contributing to PM2.5, polluting industries emit gases like sulphur oxide, nitrogen oxides, ammonia and others which are toxic and also lead to the formation of "secondary" PM2.5 through chemical reactions in the air. A 2016 IIT Kanpur study found "secondary" PM2.5 contributed 51% to the total load of PM2.5 in Delhi's air.

This IIT Kanpur study, "Comprehensive Study on Air Pollution and Green House Gases (GHGs) in Delhi", pointed out that thermal power plants around Delhi (in a radius of 300 km with installed capacity of over 11,000 MW) were expected to contribute to "secondary" PM2.5 and that an earlier study found power plants contributing nearly 80% of sulphates and 50% of nitrates in the air.

It also drew attention to Delhi's winter's "very hazy and characterised by smoky and unhealthy air" and primarily blamed it on polluting industries: "The consistent and major contributors appear to be secondary particles and combustion-related emissions with modest contribution of burning of MSW (municipal solid waste)."

The study listed top polluters (PM2.5) as road dust (38 %), vehicles (20 %), domestic fuel burning (12 %) and industrial sources (11%) and took note of contributions of stubble burning in Punjab, Haryana and other local biomass burning in addition to air pollution load.

Also Read: Rebooting Economy 36: Job creation is nobody's business in India

A 2018 "reference note" of the Lok Sabha Secretariat on Delhi's air pollution and meant for Members of Parliament (MPs) (marked "for the use of Members of Parliament" and "not for publication" but is available on web) said air pollution control devices installed in many industries were "found in idle conditionswhich lead to the emission of pollutants directly into the atmosphere without any filtration".

"Further", it said, "construction of short chimneys also restricts the polluting gases to escape into the upper layers of the atmosphere". It did not mention any punitive action against these polluting industries.

A short trip to Haryana's Bahadurgarh on Delhi's outskirts on any winter day would demonstrate how these two factors (non-filtration of emissions and low chimneys) fill the air with low hanging toxic fumes capable enough to end the trip in a hospital bed.

No such laxity has been shown to other major pollutants (vehicular emissions and dust). For example, the Delhi government ran an Odd-Even scheme for regular vehicular traffic for some years (not all) and there have been court instructions on dust control leading to sprinkling of water on trees and streets to reduce dust.

Not once did a government or court questioned or acted against the polluting industries.

The Supreme Court (SC) was so worried about stubble burning this year that it set up a committee under retired Justice MB Lokur to monitor it, notwithstanding the fact that the Central Pollution Control Board (CPCB) has deployed 50 teams across 5 states to check air pollution.

Also Read: Rebooting Economy 35: Is fixed term employment a boon or bane for India's workforce?

Stubble burning during October-November

Since stubble burning's contribution to Delhi's air pollution is limited to winter months, the SAFAR-India's daily tracker restricts it to these months.

Here is its tracker from 2019, showing the contribution of "external biomass" burning (stubble burning in Punjab, Haryana and Uttar Pradesh) to Delhi's PM 2.5 level.

A multi-institutional study published in March 2020 and carried out by Pune's Indian Institute of Tropical Meteorology (IITM) which runs the SAFAR-India, Mohali's Indian Institute of Science Education and Research (IISER), Colorado's National Centre for Atmospheric Research (NCAR) and others found: "On average, around 20% of PM 2.5 concentration in Delhi during the post-monsoon season (October-November) was found to be contributed by non-local fire emissions."

Another multi-institutional study of 2020, involving IITM (Pune), CPCB and others, found stubble burning in northern states during October-November 2018 contributing1% to 58%to PM2.5 concentration in Delhi's air.

As on October 21, 2020, here is what the SAFAR-India's PM 2.5 tracker shows.

Why Delhi's air pollution is acute in winter?

There is more to Delhi's air pollution than stubble burning, industrial and vehicular emissions and dust. Those are geographical and meteorological factors.

Also Read: Rebooting Economy 34: Temporary jobs hurt both workers and economy

Delhi is land-locked, unlike Mumbai or Kolkata, depriving it the advantages of sea breeze blowing away pollutants. It has hot desert (The Thar) on west, hot central plains on south and cool hills on north; wind directions change frequently and its weather is extreme (hot summers and cold winters).  

In winter, its cold and foggy air traps pollutants at lower heights, forming a toxic canopy that chokes people. Into it blows in smokes from Punjab's stubble burning but that does not raise the PM2.5 level on all days of October-November.

This variation in stubble burning's contribution to PM2.5 was explained by the 2020 study by IITM, CPCB and others mentioned earlier ("Objective evaluation of stubble emission of North India and quantifying its impact on air quality of Delhi") which found a variation of 1% to 58% in October-November 2018.

It said the highest contribution to PM2.5 (58%) was recorded on November 5 and the lowest (1%) on November 17, 2018 even though both occasions witnessed "reasonably high fire counts".

Also Read: Rebooting Economy 33: Where have the good old full-time decent jobs gone?

The difference, it said, was due to wind directions. On November 5, it blew from north-west - the stubble burning sites of Punjab and Haryana -and on November 17 from south where no stubble burning was witnessed.

It also drew attention to "mixed layer height", the upper lid (layer) of surface atmosphere which prevents particles and gases generated from surface to escape into the upper atmosphere. On November 5 this layer was very close to the surface at 162 metres and on November 17, it was much higher at 434 metres.

Higher wind speed also plays a big role. Experts would tell you if wind speed is high it would carry stubble burning smoke farther away from Delhi, towards the central India.

Also Read: Rebooting Economy 32: Wage code leaves millions of workers out in cold

Also Read: Rebooting Economy 31: Will new labour codes protect more workers or less?

Also Read: Rebooting Economy XXX: Rural India in far deeper crisis than what govt data claims

Rebooting Economy 38: What makes stock markets and billionaires immune to coronavirus pandemic?

 A study by two multinational giants UBS and PwC says "huge fiscal and quantitative easing packages" given by governments around the world drove a V-shaped recovery of stock markets and billionaires' wealth surged to $10.2 trillion by the end of July 2020

twitter-logoPrasanna Mohanty | October 20, 2020 | Updated 22:37 IST
Rebooting Economy 38: What makes stock markets and billionaires immune to coronavirus pandemic?
The IMF's October 2020 World Economic Outlook report projects global economic growth to plunge to minus 4.4% in 2020 - from a plus 2.8% growth in 2019

Here's a new twist to the US presidential elections relevant for the rest of the world.

President Donald Trump is warning wealthy Americans that if voted to power his opponent and Democratic candidate Joe Biden would "do big, big tax cuts, big, big tax increases, like at a level that's never been seen". He told Fox News that Biden's tax plan would be a "disaster" and put America into "depression, the likes of which our country has never seen before".

Biden proposes to tax 2% of wealthiest Americans to reduce income gap and eliminate Trump's tax bonanza to them. Trump has been very generous to the wealthy, first cutting corporate and income tax and giving exemptions in estate and gift tax, which benefitted the wealthy more than ordinary Americans, and then altering tax laws in his pandemic relief packages to help them even more.

Trump is the first billionaire President of the US (net worth of $2.3 billion as on October 16, 2020), according to Forbes magazine. He has claimed to have paid millions of dollars in income tax to the US government even while refusing to disclose tax filings.

Investigations by the New York Times (NYT), however, revealed that he paid just $750 tax the year he won the presidency (2016) and the next (2017) - less than what ordinary Americans pay.

Also Read: Rebooting Economy 36: Job creation is nobody's business in India

The NYT investigations also revealed that Trump "had paid no income taxes at all in 10 of the previous 15 years - largely because he reported losing much more money than he made".

Demands to tax billionaires gather momentum

Biden is not alone. The global campaign to tax billionaires has gathered momentum in the US and Europe in recent times, particularly because of a surge in their wealth during the pandemic while the global economy has tanked and millions have lost their jobs and incomes.

The US senator (independent) Bernie Sanders recently moved Make Billionaires Pay Act to levy one-time 60% tax on billionaires' gains during the pandemic to recapture a part of their "extreme wealth gains". This aims to raise $420 billion for paying healthcare expenses of uninsured or underinsured households.

Sanders' move is a throwback to "excess profits tax" imposed post-World War I to generate resources for reconstructing war-ravaged Europe. The logic then was that some businesses (like food and ammunitions) had profiteered, made windfall gains due to war-time situations without adding value and hence, was "unearned".  

That move didn't end well, as the subsequent history reveals, leading to a debt-driven business model (interest on loans is tax free) that uses public money to run private businesses and make private profits but shifts business risks to taxpayers (NPAs). (To know how, read "Rebooting Economy XIV: Debt vs equity; why businesses are debt-driven ")

Many global agencies and institutions, like Tax Justice Network (TJN) and Americans for Tax Fairness (ATF), Forbes, Institute for Policy Studies (IPS) and Inequality.org etc., have been seeking higher taxes on the wealthy and/or actively collaborating in tracking billionaires' wealth during the pandemic.

The latest update, released on October 8, 2020 by the Inequality.org ("Updates: Billionaire Wealth, U.S. Job Losses and Pandemic Profiteers") continues to make shocking revelations:

  • Globally, billionaires added $1.5 trillion and
  • US billionaires added $850 billion during the pandemic.

Their earlier update of September 28 said the US billionaires had added $845 billion since March 18 amidst ruins all around:

  • 6.6 million Americans got infected and almost 200,000 died;
  • Over 50 million Americans lost jobs; 30 million collecting unemployment benefits;
  • Nearly 30 million Americans went hungry and
  • 12 million Americans lost employee-sponsored health insurance.

Forbes said the pandemic saw US billionaire Jeff Bezos becoming the world's first ever $200 billionaire in August. It also said between April and July, billionaires worldwide added their wealth by 27% - the highest ever.

Governments' stimulus led to stock market boom

What led to such a surge in billionaires' wealth?

The answer comes from "Riding the Storm", a report co-published by two multinational giants UBS and PwC on October 7, 2020. It said "the V-shaped equity market recovery from April to July 2020 propelled billionaire wealth to a new high" and that the wealth of billionaires (2,189 of them) increased to $10.2 trillion at the end of July 2020.

Also Read: Rebooting Economy 35: Is fixed term employment a boon or bane for India's workforce?

What led to this V-shaped stock market recovery?

Their report explained: "Billionaire wealth is loosely correlated with equity markets, due to holdings in listed companies, and a few weeks makes a big difference. From the end of March, governments' huge fiscal and quantitative easing packages drove a recovery in financial markets. By the end of July 2020, billionaire wealth was back above its 2019 level."

The Forbes' report on this finding helpfully explained how governments helped billionaires through their stimulus packages. About the US, it said: "The CARES Act coronavirus relief package has only helped those (stock market) gains. A loophole in March's legislation allowed millionaires to benefit to the tune of about $1.7 million from the government. A further 133 large companies have since received $5 billion from the Treasury Department."

As for the UK, it said "stimulus packages worthover 16 billion pounds ($20.6 billion) have gone directly into billionaire-owned companies, data in June revealed".

Why did stock market boom help the wealthy alone?

Forbes explained this too: More than 50% off stocks and shares owned by American households were held by the richest 1% in February 2020 and as stock markets boomed since March, the wealthiest saw the biggest gains.

Isn't it interesting that stimulus packages led to a V-shaped recovery of stock markets alone but not any other segment of economy?

The IMF's October 2020 World Economic Outlook report projects global economic growth to plunge to minus 4.4% in 2020 - from a plus 2.8% growth in 2019.

Also Read: Rebooting Economy 34: Temporary jobs hurt both workers and economy

India's booming stock markets

India's case is not very different.

Forbes also carried a report on Indian billionaires on October 8, "Forbes List of India's 100 Richest Shows Gains In Wealth Despite Pandemic".  

It said: "Amid the Covid-19 pandemic which hit India hard and led to a sharp economic contraction, half of the nation's 100 richest on the 2020 Forbes India Rich List saw gains. Their collective net worth rose 14% to $517.5 billion from a year earlier, even as the benchmark BSE Sensex stock index remained flat from a year ago."

It didn't attribute this rise entirely to stock market gains and explained individual cases. However, stock markets remain the only economic activity to witness a sharp V-shaped recovery. The BSE Sensex crossed the 40,000-mark on five occasions in the first fortnight of October, coming close to its all-time high of 42,063 recorded on January 17, 2020 - a quarter (Q4) that saw the GDP plunge to a new low of 3.1%.

The same happened with Nifty50 also, which crossed the 11,930-mark thrice in the first fortnight of October, coming very close to its all-time high of 12,362 recorded on January 14, 2020.

Also Read: Rebooting Economy 33: Where have the good old full-time decent jobs gone?

Here is how BSE Sensex and Nifty50 have behaved since January 2020. As of October, the closing mark of October 15 has been taken.

What happened in October to warrant the surge?

The RBI and National Statistical Office (NSO) released high-frequency data on October 9 and 12, respectively. The RBI projected the GDP growth to plunge to minus 9.5% for the full fiscal year. A few days later (October 13), the IMF revised its India's growth projections downward to minus 10.3%. Not to forget the August end NSO data showing Q1 of FY21 had plunged to minus 23.9% - the sharpest fall among all major economies.

The RBI also released high-frequency indicators showing improvement but those related only to the organised sector, leaving out the unorganised sector contributing 45% to the GDP. Interestingly, these gains were plotted on year-to-date (YTD) basis from February 2020. YTD growth is counted from the beginning fiscal year - January for most developed countries, and April for India. What is the logic of plotting it from February 2020 except to paint a picture rosier than what it actually is.

The NSO and other RBI high-frequency data for October 2020 revealed that the gains made in June and July had reversed in August and September, particularly in industrial production, credit outflow and consumer sentiment on current economic situation, employment, income and spending. (For more read "Rebooting Economy 37: Do high-frequency data suggest V-shaped recovery? ")

On September 29, theBusiness Todayhad published a report on corporate filings for Q1 of FY21, saying that about 3,100 non-financial firms (non-BFSI firms) reported a loss of Rs 6,911 crore, against a profit of Rs 95,950 crore in the corresponding previous quarter - a drop of over Rs 1 lakh crore. More than half of these firms had slipped into the red. (For more read "Q1 profit erodes Rs 1 lakh crore; India Inc. slips into the red")

Also Read: Rebooting Economy 32: Wage code leaves millions of workers out in cold

The reason for the stock market boom is same as elsewhere: liquidity infusion.

India's stimulus packages are liquidity-heavy. Of the Rs 21 lakh crore package announced until October 11, 91-93% constituted liquidity infusion (collateral-free loans and other credit facilities to industry and individuals) and the rest 7-9% fiscal spending. The third one announced on October 11 (Rs 1.01 lakh crore), is nothing more than re-juggling and frontloading of existing fiscal plans.

Disconnect between stock market and economy

Here is a new study on stock market's link with economy.

Even while the US President Trump was boasting about stock market booms to claim credit in handling the pandemic, the Ohio State University published a study on October 6 2020, "Has the stock market become less representative of the economy?"

It looked at employment generation by listed US firms, including those at the top in market capitalisation and found that these firms "contribute less to total non-farm employment and GDP now than in the 1970s".

Also Read: Rebooting Economy 31: Will new labour codes protect more workers or less?

From John Maynard Keynes to Joseph Stiglitz and Paul Krugman, many liberal economists (capitalist) have likened the stock market to a "casino".

But the neoliberal economists (radical right) continue to advocate Market Efficiency Hypothesis (MEH), which posits that investors are rational, well-informed and market is efficient and self-correcting. They argue a free-market always gets the asset prices right. (For more read "Rebooting Economy I: Why stock market is booming when COVID-19-hit economy sinks " & Rebooting Economy II: What stock market boom means to people and economy ")

No evidence has been found for any of the MEH concepts in the past 40 years and yet the radical right has not flinched there. Trump is a shining example of it who likes to think stock market represents economy and a booming stock market means well-being of people.

Also Read: Rebooting Economy XXX: Rural India in far deeper crisis than what govt data claims

Rebooting Economy 37: Do high-frequency data suggest V-shaped recovery?

 Several critical high-frequency indicators show that in August and September the improvements noticed in June and July reversed; high-frequency data, in any case, tells the story of organised sector but not unorganised sector contributing 45% to GDP

twitter-logoPrasanna Mohanty | October 20, 2020 | Updated 20:44 IST
Rebooting Economy 37: Do high-frequency data suggest V-shaped recovery?
High-frequency data being relied upon by the government are organised sector indicators, which say nothing about the unorganised sector contributing 45% to the GDP

Economic Affairs Secretary Tarun Bajaj took out what seemed to be additional fiscal spending provided in the third stimulus package of Rs 1.01 lakh crore (capex, LTC vouchers and festival advances of Rs 73,000 crore) announced on October 11. He said there would be no change in the overall borrowing target of Rs 12 lakh crore fixed for FY21 earlier.

Drawing attention to this, economist Pronab Sen asserts that this package is not a stimulus package at all. He says all that the central government is doing is front-loading its fiscal expenditures and switching their use to both LTC vouchers and capex. With the borrowing limit intact, this would mean cutting down on other fiscal spending.

The earlier two stimulus packages of Rs 21 lakh crore (Pradhan Mantri Garib Kalyan Yojana of March 2020 and Aatmanirbhar Bharat Abhiyan packages of May 2020) added up to a fiscal spending of 0.75-1% of the GDP. With no further additional fiscal spending, the stimulus for economic recovery remains insignificant.

Also Read: Rebooting Economy 36: Job creation is nobody's business in India

Taken together, the three stimulus packages would give an impression that the central government is banking on a natural V-shaped economic recovery even after the first quarter GDP (FY21) dropped down to minus 23.9% - the worst among all major economies during the same quarter.

Do the high-frequency economic indicators really give an indication of a natural V-shaped recovery?

Here is a reality check.

What do high-frequency indicators tell?

On October 12, the National Statistical Office (NSO) released industrial production (IIP) data for August 2020.  

This data shows the recovery witnessed after April 2020 (when the IIP general index touched a record low of minus 57.3%) took a beating in August (2020). Both the manufacturing and electricity IIPs, often quoted by government officials to assert a V-shaped recovery, turned the wrong way.

Will these graphs turn upward in September 2020? That would be known a month later.

In the meanwhile, more high-frequency data has been published.

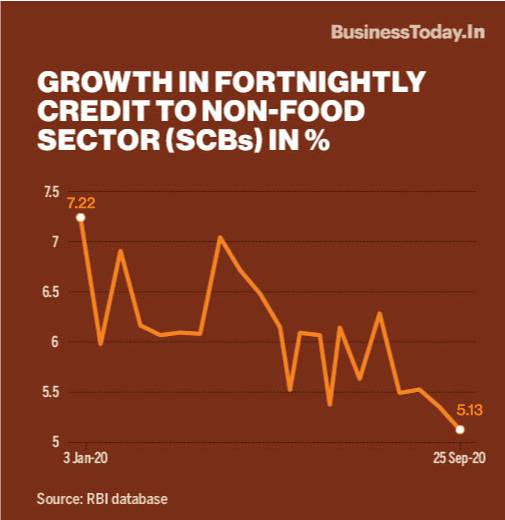
The RBI's data on fortnightly credit outflows from the Scheduled Commercial Banks (SCBs) to the non-food sector demonstrates a progressively downward swing inAugust and September(fortnight ending on September 25).

This high-frequency data (fortnightly) does not disclose sectoral deployment of credit. An SBI research paper released on October 8, 2020 analysed monthly credit deployment and made some shocking revelations.

It said in August 2020 the monthly growth in credit to industry witnessed a massive fall - of minus 426%. Infrastructure, which is part of industry, fell sharply by minus 314%. The agriculture sector witnessed a decline by minus12%. Personal loan and services were the exceptions, with positive growth.

Also Read: Rebooting Economy 35: Is fixed term employment a boon or bane for India's workforce?

For a better perspective on these high-frequency data of a limited period, here is the big picture.

The following graph maps annual growth in bank credits to the non-food sector and the GDP (2011-12 base, constant prices) to make better sense of the state of economy.

Note how far the economy is down even as the pandemic hit.

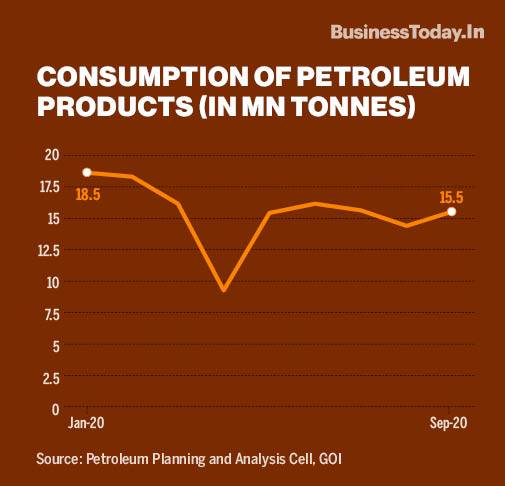
Another high-frequency data often cited to justify a V-shaped recovery is the consumption of petroleum products.

The graph below maps the consumption data in million tons (MT), as provided by the Ministry of Petroleum and Natural Gas. Consumption has improved since April 2020 but in September 2020 it was way down from the pre-pandemic January 2020 level when it was 3 million tons higher.

Households under stress, savings declining sharply

More trouble has surfaced through another high-frequency data.

Another SBI research paper (released earlier on October 1) looked at monthly household savings and consumer leverage (incremental credit through credit cards, personal loans, advances against FD, shares etc.) for August and September 2020.

It said: "The data... revealed that deposits (savings, current and term) which increased to Rs 1.21 lakh crore in Unlock 2 (July 2020) havedeclined significantly during Unlock 4(September 2020)." The maximum decline is seen in savings bank deposits. Further, the consumer deleverage also declined in August "indicating the stress on household balance-sheets now emerging with gusto".

Also Read: Rebooting Economy 34: Temporary jobs hurt both workers and economy

The paper did not explain the fall in savings deposits but wondered how much of the consumer leveraging was due to the lockdown/lack of business and how much due to consumers "maintaining a discipline in consumer behaviour".

Nevertheless, the meanings are very clear: the full impact of the massive loss of jobs and other livelihood sources caused by an untimely, unthinking and unplanned lockdown is being reflected in September 2020.

The paper said, in September 2020, the bank's savings fell by (-) Rs 1.25 lakh crore and total deposits (including savings, current account and term deposits) fell by (-) Rs 44,339 crore.

Here is yet another high-frequency indicator.

On October 9, the RBI released its latest consumer confidence survey (CCS).

On all key questions, like general economic condition, employment, income and spending, the consumer perception shows that the current situation is progressively worsening from January 2020 to September 2020, with the only exceptions being price and inflation.

Also Read: Rebooting Economy 33: Where have the good old full-time decent jobs gone?

The following graph maps the rise in the percentage of consumers, stating that the current situation has "worsened".

Organised sector indicators reveal half the truth

High-frequency data being relied upon by the government (except agriculture), like electricity demand, auto sales, steel demand, e-bills or the IIP and credit outflow etc. used here, are organised sector indicators, which say nothing about the unorganised sector contributing 45% to the GDP (as estimated during the 2011-12 rebasing of GDP).  

Also Read: Rebooting Economy 32: Wage code leaves millions of workers out in cold

Even the agriculture (unorganised sector) data presented in Q1 of FY21 is highly exaggerated since the output of two subsectors - livestock and forestry and fisheries accounting for 47% of GVA (in Q1 of FY20) - is based on "production targets", rather than actual production.

This had never happened earlier. (For more read "Rebooting Economy XXVIII: Is India poised for agriculture-led economic turnaround? ")

The bottom line: Relying on a natural V-shaped recovery may turn counter-productive.

Also Read: Rebooting Economy 31: Will new labour codes protect more workers or less?

Also Read: Rebooting Economy XXX: Rural India in far deeper crisis than what govt data claims

Rebooting Economy 70: The Bombay Plan and the concept of AatmaNirbhar Bharat

  The Bombay Plan, authored by the doyens of industry in 1944 first envisioned state planning, state ownership and control of industries to ...